Dashboard
The WebWatchBot Dashboard provides a comprehensive view of Watch Items being monitored. There are four key controls on the dashboard: Failing Watch Items, Slow Watch Items, Uptime/Downtime, and Health Status.
* The Dashboard is only available in the Enterprise Version of WebWatchBot Manager (Windows Client).
Access the Dashboard from the WebWatchBot Manager shorcut
Health Status
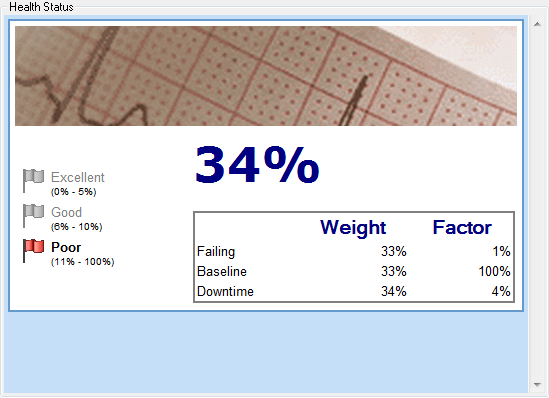
The Health Status is an overall health measurement of what is being monitored. It is one of the four quandrants of KPI (Key Performance Indicators) that the Dashboard displays.The Health Status displays a overall rating of the health of Watch Items for the selected filter and time frame. The overall rating is a weighted average of three factors:
- Failing - This factor represents a weighted average of Watch Item failure rates. Each Watch Type is weighted differently and can be changed through Dashboard Settings.
- Baseline - This factor represents the total number of Watch Items with failure rates higher than the selected baseline Watch Item divided by the total number of Watch Items.
- Downtime - This factor represents the total amount of cumulative downtime divided by the total amount of cumulative time each Watch Item has been in existance since being created.
Failing
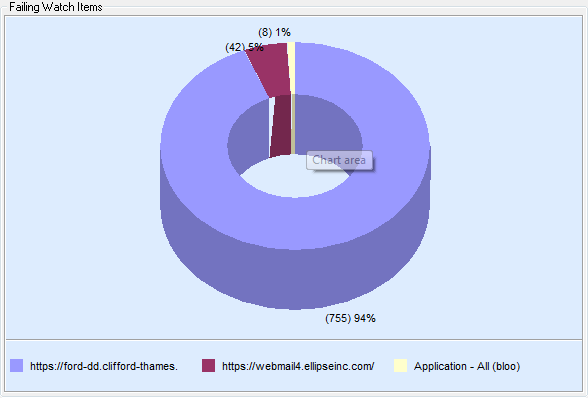
This pie chart shows Watch Items with the highest failure rate for the selected filter and time frame.Hover the mouse over a pie slice to separate it from the entire chart.
The number of Watch Items displayed is dependant on the dashboard setting "Max to Show". For each slice of the pie chart, the number in parenthesis is the total number of failures, and the percentage of failures compared to the cumulative number of failures for the displayed failing Watch Items.
Uptime/Downtime
This pie chart shows the total cumulative uptime and downtime of each Watch Item has been in existance since being created, for the selected filter and time frame.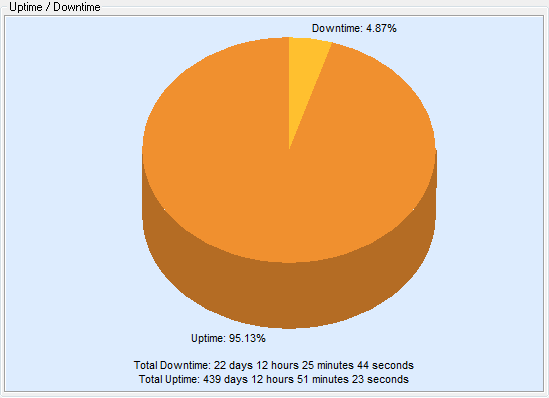
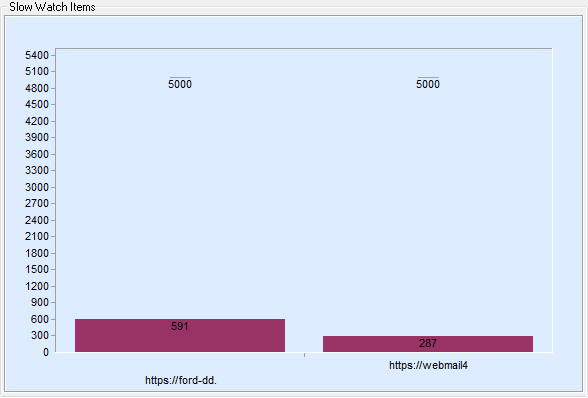
Slow watch Items
This bar chart shows the slowest Watch items for the selected filter and time frame. A Watch Item is considered to be slow when its average response time is larger than the maximum number of Response Time Maximum in ms.The cylinders represent the average response time for each WatchItem and the blue line represents the response time maximum in ms as defined under Watch Item Properties
Filter
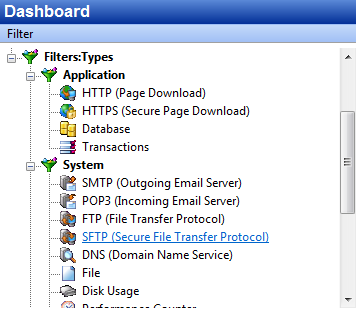
Filters affect each of the four quandrants of the KPIs allowing you to drill-down into specific types of monitors.Filter by Status, e.g. Active, Suspended, Up, Down
Filter by Type, e.g. HTTP, SMTP, Database, etc.
As a time frame is selected, the data is updated in real-time
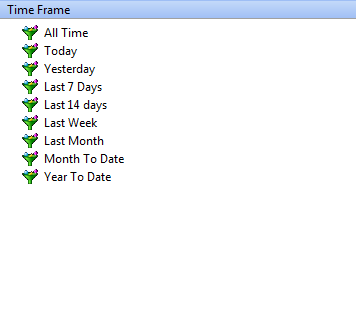
Time Frame
The "Time Frame" selection allows further drilling-down to limit the data reported in the four quandrants of the KPIs.As a time frame is selected, the data is updated in real-time