Reporting
WebWatchBot provides numerous built in reports that are customizable to suit your needs.
Summary Report
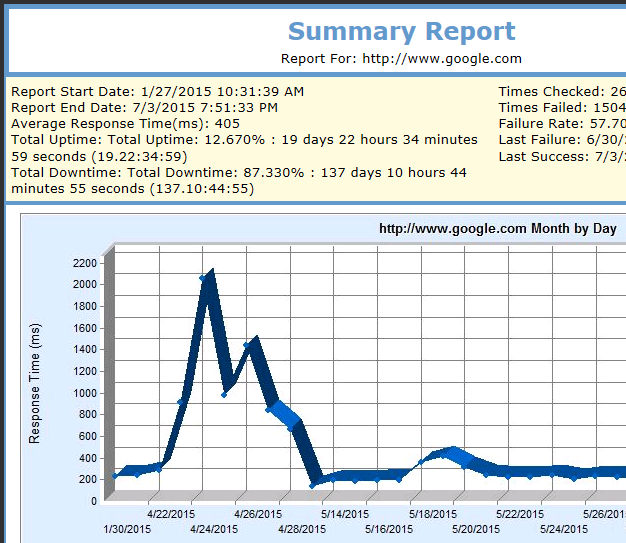
The standard report that gives at-a-glance statistical information for a monitor or a group of monitors, including:- Average Response Time
- Total Uptime
- Total Downtime
- Number of times the monitor has been checked
- Number of times the monitor has failed a check
- Failure rate percentage
- Last failed check
- Last successful check
Like all reports, the summary report is customizable and may include one of the four chart types. The chart shown here is the performance chart.
Uptime / Downtime Report
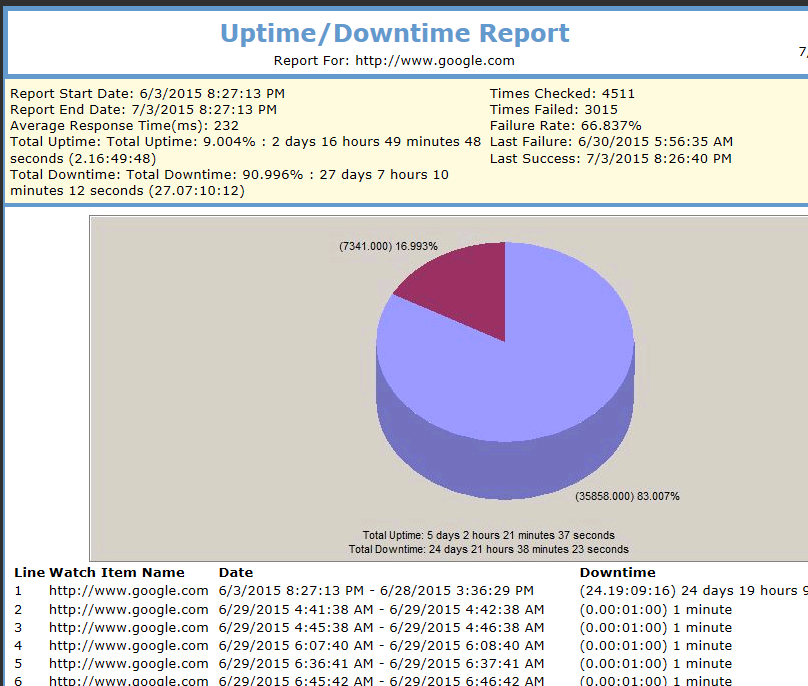
The Downtime Report displays detailed information on when downtime occurred and how long it lasted.The standard heading, included in all reports, shows basic statistics for the reporting date.
This report includes a pie chart, displaying the total uptime and downtime, along with cumulative statistical data for each.
In the report detail, each occurance of downtime is reported.
Failure Report
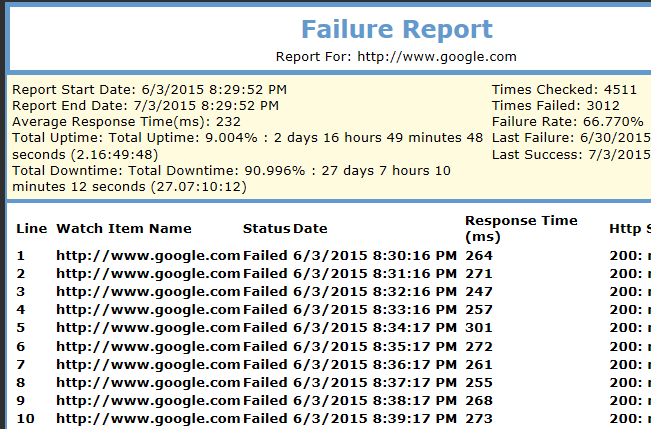
The Failure Report displays detailed information on when failures occurred.The standard heading, included in all reports, shows basic statistics for the reporting date.
This report does not include a chart; however, you may customize the report to include one.
In the report detail, each occurance of failure is reported along with the reason for the failure.
Performance Report
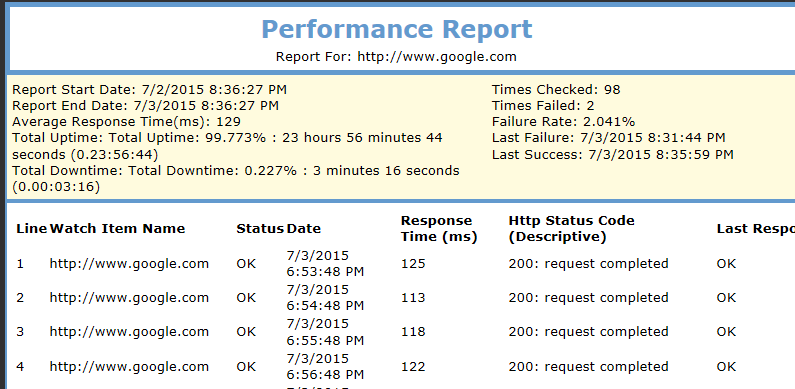
The Performance Report displays details on the response time each instance a Watch Item was monitored. Because every check is reported, the size of this report can be very large. It is most useful for exporting to other tools for analysis.The standard heading, included in all reports, shows basic statistics for the reporting date.
This report includes a performance chart (not shown).
In the report detail, each check is reported.
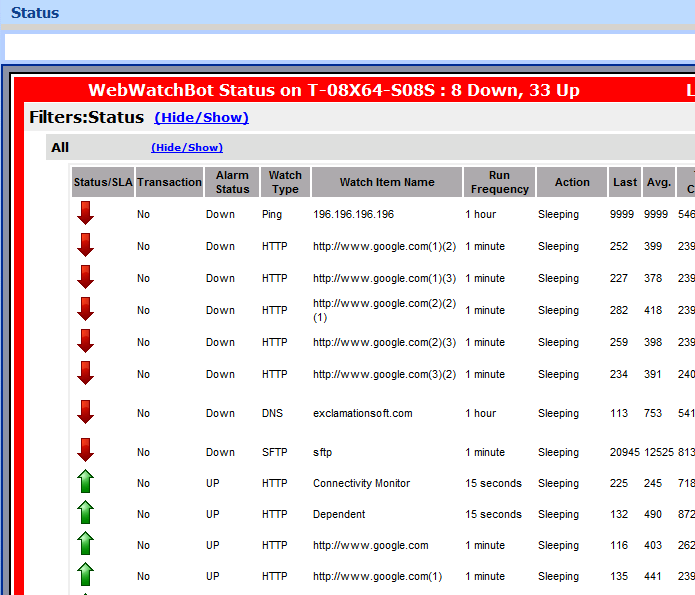
Status Report
The Status Report is a continously and automatically updated report that offers an at-a-glance detailed view of Watch Items, Transactions, and Watch Groups.The report groups monitors according to filters, e.g., UP, DOWN, Smtp, Http, etc.
A "master" status report is automatically created and updated for everything being monitored. A separate status report is also created for each "Watch Group"
The report is customizable and may also be automatically uploaded to your website for viewing.